Note
Click here to download the full example code
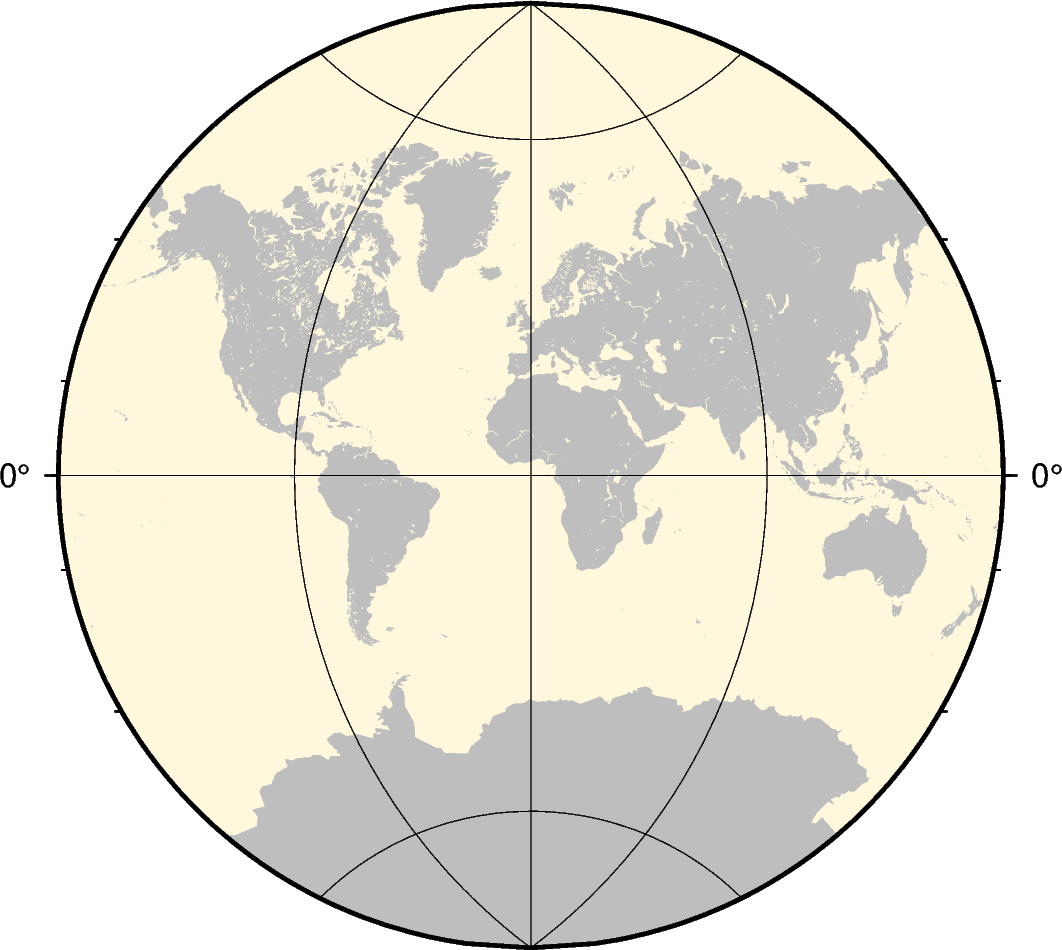
Van der Grinten
V[central meridian]/width: Give the optional central meridian (default is the centerof the region) and the map width.
Out:
<IPython.core.display.Image object>
import pygmt

fig = pygmt.Figure()
# Use region "d" to specify global region (-180/180/-90/90)
fig.coast(region="d", projection="V12c", land="gray", water="cornsilk", frame="afg")
fig.show()
Total running time of the script: ( 0 minutes 0.698 seconds)